The dashboard is where a reviewer reads the study. Every table is drawn from its results, and each number opens a trace.
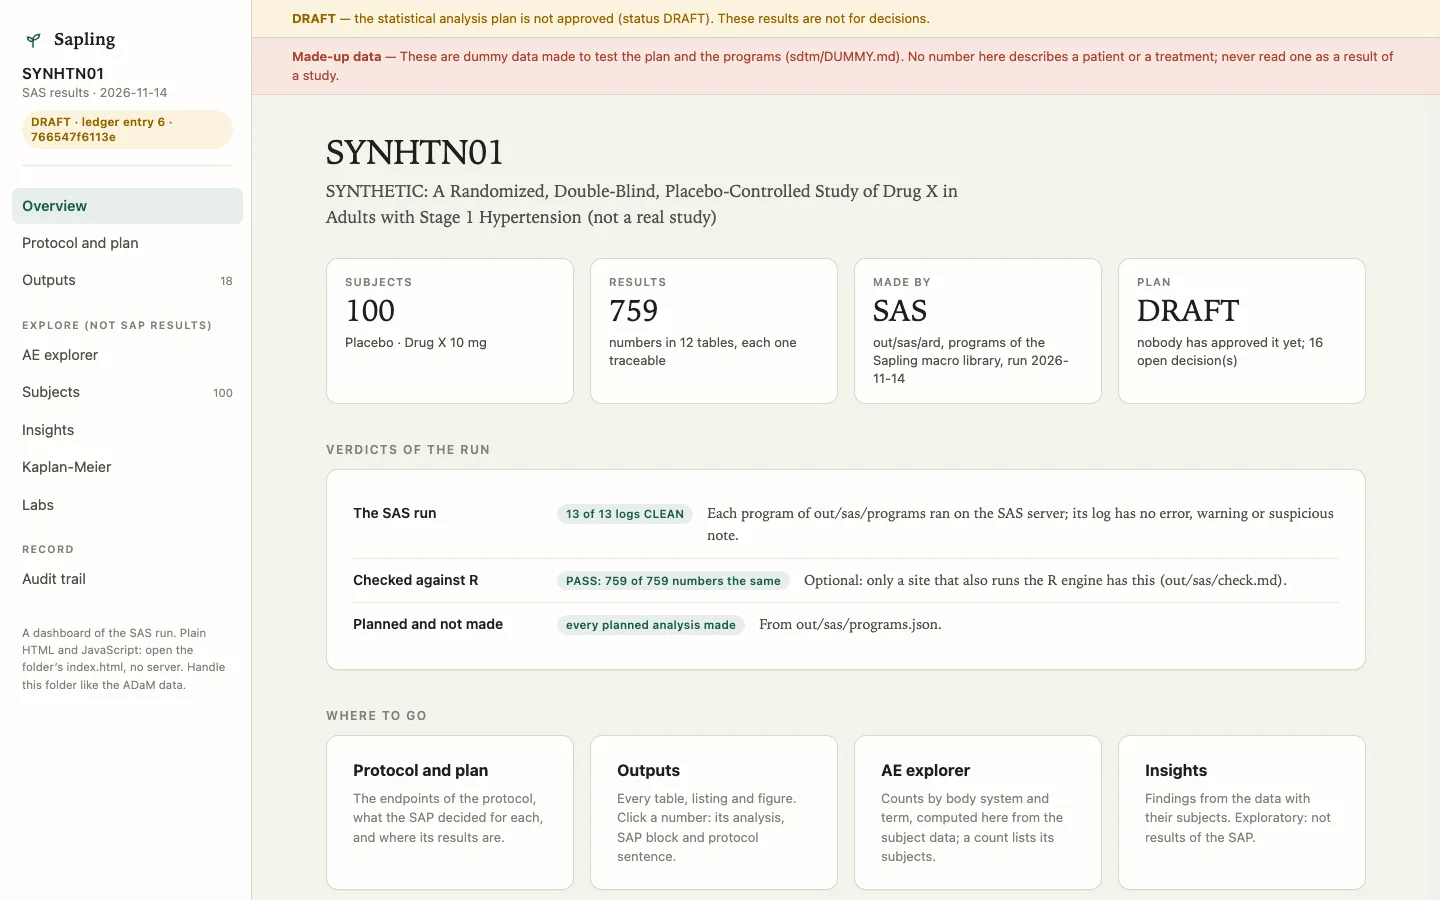
Two dashboards#
- With R:
sapling dashboardstarts the dashboard of the R engine (an app on a free port) after the tables are made. - With SAS:
sapling sas dashboardmakes a folder of plain HTML and JavaScript from the products of a SAS run: no R, no server, no network. It opens by double click onindex.html. A team that runs only SAS has the same pages.
Each has a gate: sapling dashboard --check and sapling sas dashboard --check rebuild the dashboard and check its numbers against the results. A number that differs by one character makes the gate fail.
What is on the pages#
- Overview: the study, the numbers, the engine, the verdicts of the run, and a banner that says the plan is a draft until a person approves it. For dummy data, a banner says the data are made up.
- Protocol and plan: each endpoint of the protocol, the SAP's decision for it and the outputs that answer it. A gap is shown as a gap.
- Outputs: every table, listing and figure. A number in a cell opens the trace: result, analysis, method, population, records, grouping, ADaM variables with their derivations, the SAP block with its sentence, and the protocol sentence.
- AE explorer, subjects, insights, Kaplan-Meier, labs: browsing pages for the subject-level data. Insights are fixed rules, labelled exploratory, with no AI.
- Audit trail: a chained ledger of what was read and made, with hashes. The page recomputes the chain in the browser.
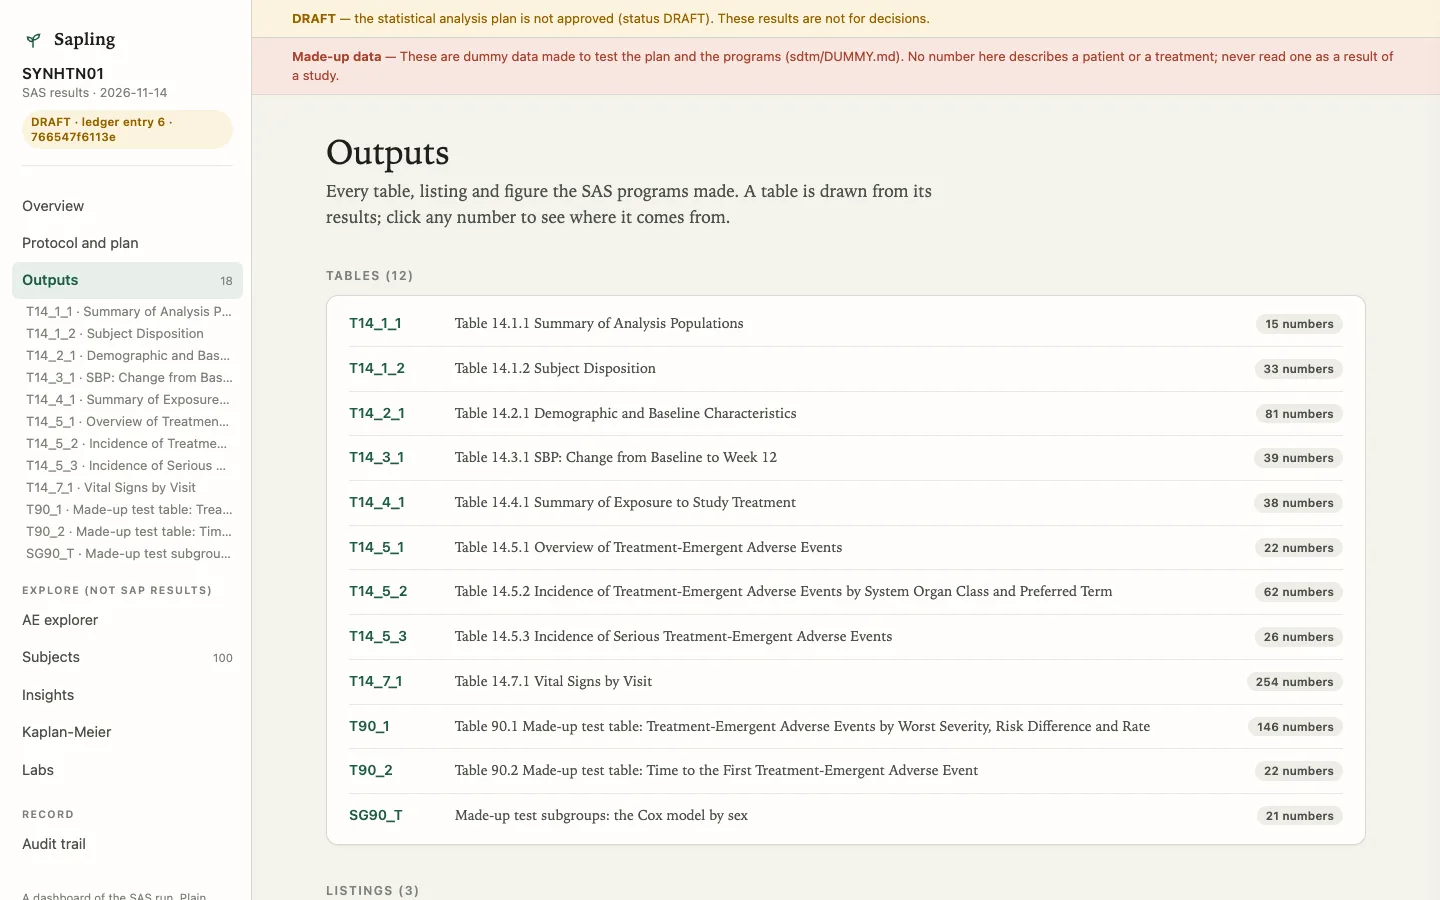
The data cut and the subgroups apply to the subject-level pages only. The tables are the results of all the data and are never recomputed in the browser. The SAS dashboard does not recompute tables on a data cut or compare them against independent programs; the R dashboard does. The page The SAS dashboard lists the differences.
Privacy#
The SAS dashboard folder contains subject-level data from the transport files that the table programs read. Handle it like the ADaM data. sapling sas dashboard --no-subjects builds one without them.