A sample size is a sentence in the protocol: "200 patients give 90% power for a difference of 6 with SD 12". The sentence hides what the study will do. Patients stop the drug, patients leave, the estimand says what to do with both, and the analysis may or may not estimate that estimand. sapling design makes this visible before the protocol is final.
The example here is a made-up trial, HTN-201. Simulated data are assumptions made visible, not evidence. No number of a simulation is a result of a study, and the report says so at its top.
A finding#
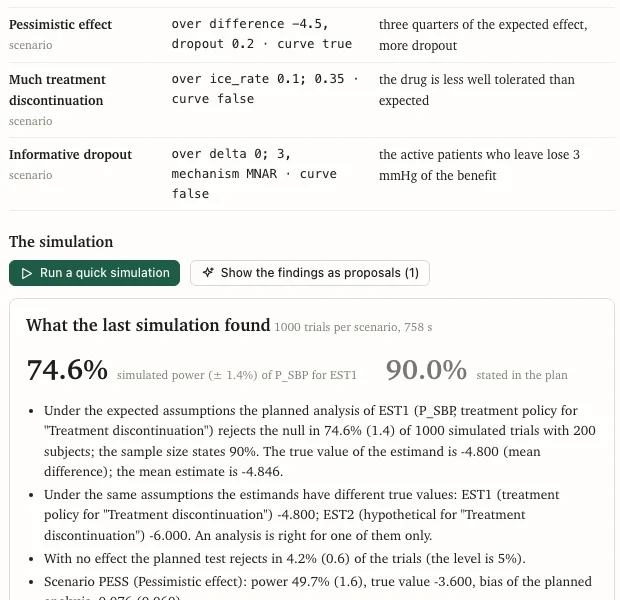
The made-up design assumes an effect of -6 mmHg on systolic blood pressure, sizes the trial for 90% power with 200 patients, and has treatment policy as the primary estimand. Its assumptions also say that one patient in five on the active drug stops it and loses the effect. Simulated under those assumptions:
- the true value of the primary estimand is -4.8, not -6;
- the power is 74.6% (Monte Carlo error 1.4%, from 1000 trials per scenario), not 90%;
- the power curve reaches 90% at about 306 patients.
Nothing is wrong with the formula. The sample size was written for one estimand and the analysis for another.
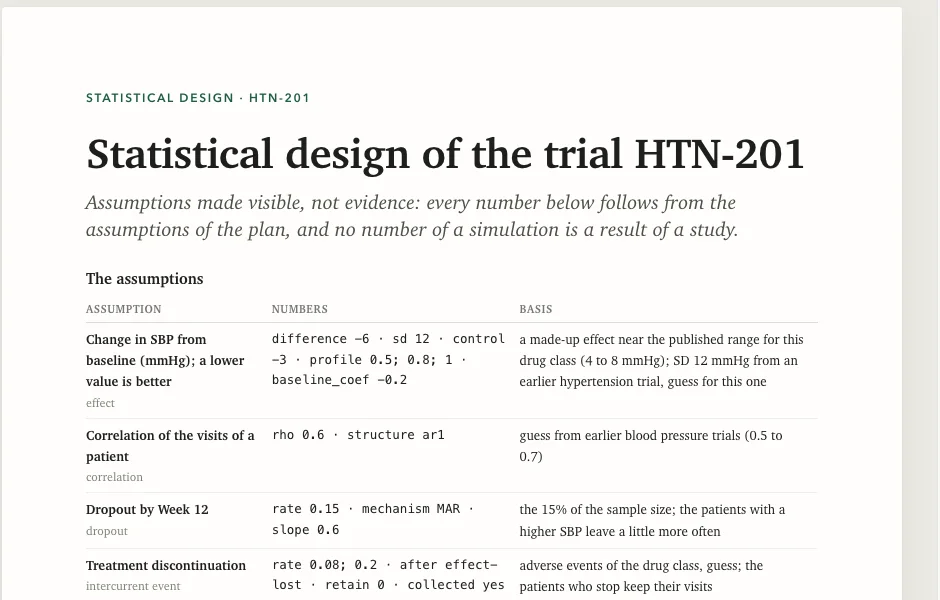
What is simulated#
- The true value of each estimand under the assumptions. A treatment-policy and a hypothetical estimand have different true values under the same assumptions.
- Power, type I error, bias and coverage of the planned analysis, against the true value of every estimand, each with its Monte Carlo error, under the expected assumptions and under pessimistic scenarios.
- The smallest N that reaches the power, and how other analyses do (ANCOVA with LOCF against MMRM) with
--compare. - Multiplicity: hierarchy, Bonferroni, Holm, Hochberg, graphical and co-primary procedures, with the probability of each rejection and the family-wise error under the global and partial nulls.
- Interim analyses: group-sequential boundaries (Pocock, O'Brien-Fleming, Lan-DeMets and Hwang-Shih-DeCani spending, computed in base R) with the probability of stopping at each look, the overall power, and the expected size and duration.
The boundaries are checked against published values. The design page also lists what is not simulated yet (non-inferiority margins, multiple imputation, more than two groups and others), and the check says so where your plan has it.

How it works#
A design plan, design.qmd, is a plan in the same language as a SAP with kind: design. It holds the design block, the objectives, the estimands, the primary and key analyses, the sample size, the multiplicity, the interim looks, the missing data and the assumptions. Then:
sapling design new htn --kind continuous   # a study folder with a made-up design to change
cd htn
sapling design check                       # the plan against itself
sapling design simulate                    # a first look: 200 trials per scenario
sapling design simulate --refine           # add trials, do not start over
sapling design export --docx               # the statistical section of the protocol
sapling new mysap --from-design .          # a SAP that starts from the design
The simulation needs R and the packages survival, nlme and MASS. Without them the editor says so, and the page still shows the plan. A first look takes seconds for an ANCOVA and a few minutes for an MMRM on several cores.
Read on#
The design commands and the plan language, section "The design plan and the assumptions block".